NEW
YORK STATE DEPARTMENT OF EDUCATION
FISCAL
ANALYSIS & RESEARCH UNIT
89 WASHINGTON AVENUE *
ROOM 301 * ALBANY, NY 12234
_______________________________________________________________________________________________________________________________________________
2004
Analysis of Local Effort
in New York State
School Districts
April
2005
Ø This
report identifies as a policy concern those school districts that are low
taxing, low spending and low performing.
Ø
Thirty-nine
districts were found to have a local effort problem, being below the median on
measures of tax effort, spending, and student performance. This reflects a decrease from the prior
year.
Ø As district need relative to fiscal capacity worsens,
the probability of being identified as a low tax effort, low spending, and low
performing district increases.
Ø
One Big Five district, Syracuse, was found to be low
effort, low spending, and low performing.
Ø
New
York City, although low taxing and low performing, was not low spending.
Ø
The
total levy loss attributed to low tax effort, low spending, and low performing
districts for 2002-03 was $23 million; two-thirds of this levy loss is
attributed to Rural and Upstate Suburban districts.
Ø
This
result is $582 million less than 2001-02.
Ø
Average
or median spending per pupil increased 3.2 percent while median tax effort
declined by 0.3 percent from 2001-02.
Ø
In
total, State financing for K-12 education, including STAR, only increased by
0.6 percent, relative to last year.
Ø
Therefore,
the increased ability to spend for education was largely the result of increased tax revenues from growing property values. Preliminary 2002 data suggest a 12.5 percent increase in actual
values over 2001.
Ø
Since
local effort tends to be a greater problem for school districts with high pupil
need and limited fiscal capacity, every effort must continue to be made to
ensure that State Aid to school districts accurately reflects school district
needs and costs.
Ø Maintenance
of local effort can be a formidable challenge for some school districts. SED should develop its capacity to provide
technical assistance to school districts regarding the most cost-effective ways
to use State Aid and leverage local resources.
Background
This analysis uses a three-tiered framework for analyzing
school district tax effort consistent with that which the State Education
Department has presented annually for the past seven years. It provides an update on school district
local tax effort using 2002-03 data.
In New York State, a district’s capacity to achieve a given spending
level involves a state and local partnership. Thus, even among low wealth
districts, which benefit from highly wealth equalized aid formulas, the
willingness and ability to raise funds locally
to support education is essential in assuring that all children have the
resources needed to achieve high academic standards. A clear
understanding of school district local tax effort has become an issue to New York State policymakers. Any diminution of local tax effort in high need school districts,
particularly if local tax effort is “inadequate” to begin with, poses a
significant policy concern.
Discussion
This analysis was conducted to provide a
picture of the tax effort problem. Tax
effort was examined using a modified version of the three-tiered approach
described in an October 1999 Regents report. Three measures of tax effort were used to
describe the problem: 1) “lost levy” – which refers to the amount of local tax
revenue that districts lost in 2002-03 by taxing themselves below the statewide
median tax rate of $18.21 per $1,000 actual value; 2) “effective lost levy” –
which refers to that portion of the lost levy that would have to be raised in order
to bring a district up to the median statewide spending level of $12,556 per
pupil;
and 3) effective lost levy of low-performing school districts. This second criterion was necessary to
address the fact that many districts with high property wealth can still
generate substantial local levies per pupil at relatively low tax rates.
Because of their high spending levels, the authors did not consider low tax
rates to represent an effort problem for such districts and so they were
eliminated from the effective lost levy category. It is important to note that the spending level referred to in
this analysis is the sum of a district’s General Fund, Debt Service Fund, and
Special Aid Fund.
The third criterion used to define the local effort
problem was student performance. Some
school districts may tax themselves below a statewide median tax rate, and fall
below the median spending level, but still have students that achieve high
standards. For these high performing
districts, the authors did not view their low taxing and spending behavior as
problematic, given the level of performance obtained by their students. Therefore, in order to identify low taxing,
low spending, and low performing school districts, the same notion of effective
lost levy was applied in conjunction with average student performance on the
New York State 4th and 8th grade English Language Arts
and Math examinations. For the purpose
of this study, any district with an average score below the level three
cut-point on any two or more of these four exams was considered to be in need
of improvement.
In Figure 1 below, Districts 1 and 2 are those districts
for which SED policy concerns are the greatest.

A Note on STAR
For the purpose of this analysis, tax rates were
calculated using a local levy that includes the STAR payment. This approach is consistent with the way tax
rates are calculated for State Aid purposes.
When STAR is included in the local levy, the median tax rate is $18.21
per $1,000 actual value. Another option
would have been to remove the STAR payment from the local levy. If STAR were not included in the local levy,
the median tax rate would be $14.60 per $1,000 actual value. This change would result in the
identification of 49 districts with poor performance (versus 39 districts when
STAR is included) having an effective lost levy of $24.2 million (versus $23.7
million with the inclusion of STAR).
Findings
The magnitude of the lost levy problem statewide was $3.49
billion in 2002-03. New York City had a
lost levy of $1.05 billion, accounting for 30 percent of the State total. Downstate suburban districts had a lost levy
of $1.875 billion, which represents 53 percent of the total (Chart 1).
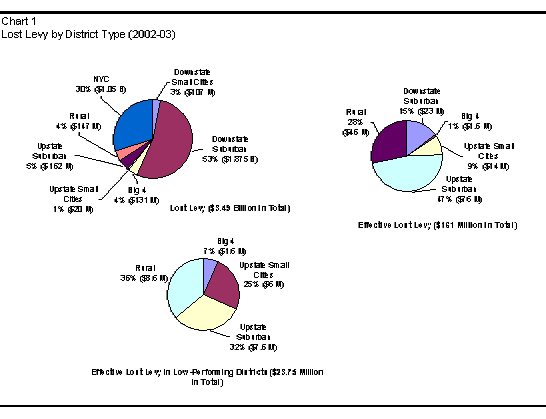
When considering only those low taxing districts that are
also spending below the median expenditure per pupil of $12,556, the total
effective lost levy is $161 million.
There were 134 districts found to be low taxing and low spending, thus
placing them into the effective lost levy category. New York City had no effective lost levy, as their
expenditure per pupil of $13,043 exceeded the statewide median. Rather, the district types making the
greatest contribution to this problem are the Upstate suburbs and rural
districts: these two categories are responsible for three-fourths of the State
total effective lost levy. These
categories are followed by the downstate suburban districts, which represent 15
percent of the statewide total.
If we further narrow the effective lost levy districts to
include only those whose performance was below a standard performance level, 39
districts were found to be in this category.
For these 39 districts, the total effective lost levy amounted to $23.7
million, of which the greatest shares derive from the following categories:
rural, Upstate suburban and Upstate Small Cities, with 36, 32 and 25 percent of
the total, respectively.
Rural districts were disproportionately represented in the
effective lost levy, low-performing category as seen in the District Type table
located in Appendix A. That is, while
rural districts account for 29.1 percent of all districts in the State, they
comprise 43.6 percent of the 39 districts with effective lost levy and poor
performance.

As shown in the decile table above, there is a strong
relationship between a district’s need relative to fiscal capacity and the low
taxing and low spending phenomenon. As
district need/fiscal capacity status worsened, the likelihood of falling into
the effective lost levy category increased. In the five lowest need/fiscal capacity
deciles, i.e., the wealthiest, only 11.8 percent of districts were found to be
low taxing and low spending, whereas in the five highest need/fiscal capacity
deciles, 28 percent of the districts were identified as effective lost levy districts.
As need/fiscal capacity status worsened, districts that
were low taxing and low spending also experienced substantial drops in
academic performance. Of the 39
districts that were identified as low taxing, low spending and low
performing (column J of Table 2), 92.3 percent fell into the five highest
need/fiscal capacity deciles.
In addition to the decile analysis, Table 1 displays the
lost levy and the effective lost levy for New York City and the Big Four
cities. While New York City, Buffalo,
Syracuse and Yonkers all had tax rates below the median, only Syracuse had
below average spending, thus falling into the effective lost levy
category. Moreover, Syracuse was found
to have performance below the standard level.
Appendix A contains similar tables representing districts by district
type and by need/resource category.
It is important to note that this framework identifies
only those districts that are low taxing, low spending and low performing as
districts of greatest local effort concern.
Districts that are low taxing and low performing, but are spending above
the median could also be considered to have a local effort problem,
particularly if they rely heavily on state revenues to achieve their spending
levels, but fail to make adequate local effort. A total of 51 districts fall into the category of low taxing and
low performing, but spending above the median expense. Included within this group are New York City,
Buffalo and Yonkers whose tax rates were below the State median; they had a
lost levy of $1,001, $683 and $3,931 per pupil respectively.
As noted previously, when need/fiscal capacity status
increases, districts are more likely to exhibit low taxing and spending
behavior. This can be attributed, in
part, to the fact that, as wealth increases, districts enjoy a greater local
levy at a standard level of tax effort.
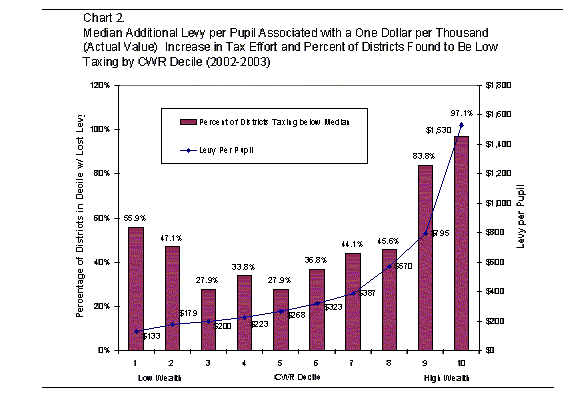
As seen in Chart 2, as the Combined Wealth Ratio (CWR) of a district
increases, so does the levy per pupil at a standard level of effort (one
mill). Therefore, low wealth districts
have less of an incentive to increase their tax effort when compared to high
wealth ones.
As shown in Chart 2, when the levy associated with a
standard level of tax effort is low, such as in the low wealth deciles, a
greater percentage of districts were found to be low taxing. As the property value per pupil increases,
and therefore the associated levy per pupil increases, the likelihood that a
district will be found to be low taxing decreases. This relationship holds up until the ninth and tenth deciles in
which the percentage of districts found to be low taxing begins to increase due
to the substantial resources generated at low tax effort levels in high wealth
districts. Therefore, we find that there
is a nonlinear relationship between wealth and local effort with very wealthy
districts and very poor districts having a greater propensity toward low tax
effort.
Changes from 2001-02: New York
City
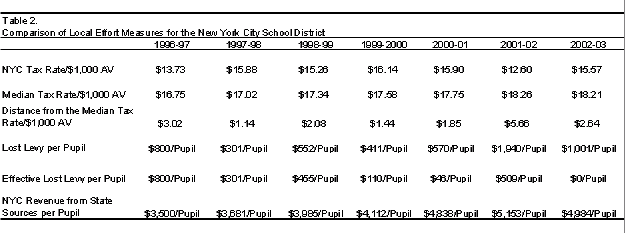
In 2001-02 the total effective lost levy for the 66
districts identified at that time as low taxing, low spending and low
performing was $605 million, of which New York City’s levy loss share was 90
percent of the total. In 2002-03, there
were 39 districts identified as low taxing, low spending and low
performing. The total effective lost
levy for these districts was $23.7 million, of which New York City had no
part.
In addition to the fact that NYC is no longer among the
districts with effective lost levy districts (row 5 of Table 2) in the most
recent year, another very significant finding is that New York City’s tax rate per $1,000 actual value has
increased significantly (23.6 percent) over the prior year, back to levels of
the late ‘90s. Both of these trends --
the improved taxing and higher than average spending behavior -- we attribute
to improvements in the New York City economy, particularly very robust housing
and real estate markets, and hence the City’s fiscal capacity to spend for
education.
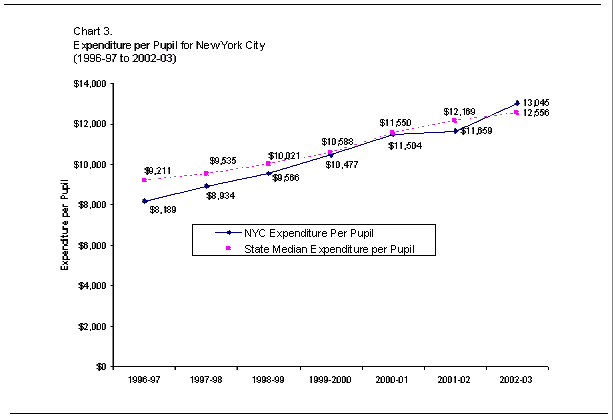
As seen in Chart 3 below, for the first time since SED
began studying local effort, in the late 1990s, New York City’s expenditure per
pupil has exceeded that of the State as a whole. The City’s spending of $13,045 per pupil is 3.9 percent higher
than the statewide median of $12,556.
This came after a period where New York City was already closing the gap
between its spending and the rest of the State, but which was stalled in
2001-02, ostensibly due to the harmful effects of the recession and the events of September 11, 2001.
Tax Effort and the
Big Four School Districts
In Chart 4 below, the tax rates for each of the Big Four
school districts are compared to the State median. While the State median tax rate was essentially flat - it changed
only marginally from the last year, from $18.26 to $18.21 - two members of the
Big Four, Buffalo and Syracuse, increased their calculated tax rates during the
same time period. Although, the former
still taxes significantly less than the average statewide district, the latter
has made significant improvement over the last year, such that Syracuse’s rate
is just under a half dollar less than the State overall (per $1,000 actual
value) at $17.76. After a period of
consistently exceeding the statewide average, Rochester lowered its tax effort
in the past year to about a dollar above the State average at
$19.17/$1,000.
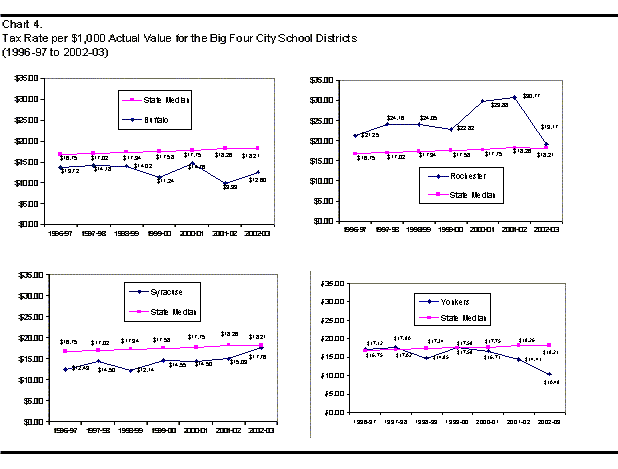
However, it should be
pointed out that this is still the highest of the Big Four and the only one in
this district category exceeding the State tax effort median. Yonkers, like Rochester decreased its local
tax effort. Yonkers’ situation however,
is made worse by the fact that that it was starting off in a lesser position
relative to the statewide median in 2001.
Yonkers slid further, to the point where its tax rate of $10.48 for
2002-03 is almost $8/1,000 actual value less than the State average. However, as we shall see in Chart 5, despite
this low tax effort, Yonkers is not spending below the statewide median. This is made possible by additional property tax revenues
resulting from a large increase in property values in 2002-03.
When changing the focus from tax rates to expenditure per
pupil, Chart 5 shows that the expenditure per pupil for three of the Big Four
school districts exceeds that of the statewide median for 2002-03. Syracuse was the only member of the group
that failed to meet or exceed the State median expenditure for the most recent
year of this analysis. However, as the
shrinking distance between the two trend lines in the chart in the lower left
corner suggests, Syracuse is closing the gap between itself and the rest of the
State.
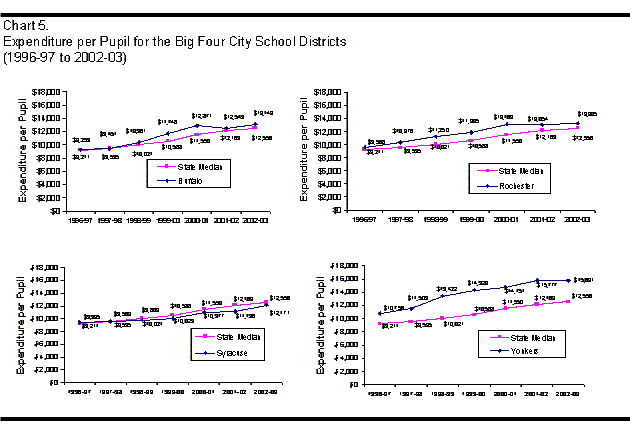
Rochester’s spending over the last two years is
essentially flat, as is Yonkers’ experience over the last year (a 0.5 percent
decrease). Buffalo’s growth relative to
the State average remained roughly the same.
In the prior year it exceeded the State median in spending per pupil by
3.1 percent, while this rate grew to 4.6 percent in 2002-03.
All Districts
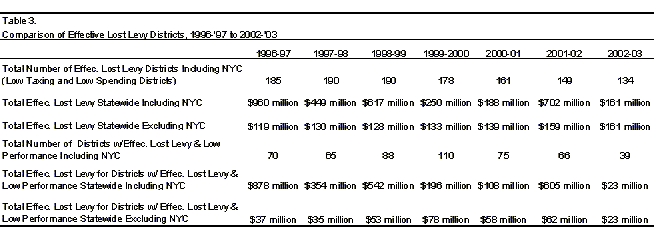
As shown in Table 3, when the number of low taxing and low
spending effective lost levy districts in 2001-02 is compared to those in the
following year, there is a decrease of 15 districts. This is roughly equal to the decrease of the prior year (of 12:
from 161 effective lost levy districts to 149). The net effect in dollar terms of this effective loss levy
declined markedly from roughly $700 million to just $161 million. We can attribute virtually all of this to
the fact that in this year’s analysis, New York City is no longer an effective
lost levy district.
When considering districts with effective lost levy and low performance, there was a very
significant decrease of 27 districts from 2001-02 to 2002-03: this is a
threefold increase over the prior year’s reduction of 9 fewer districts (from
75 to 66) with both effective lost levy and low performance. This last result reflects the general trend
of better academic performance in the elementary and middle grades statewide:
among all districts, regardless of their taxing and spending behavior. In 2001-02 240 districts had average scores
on more than one of four exams below the cut point and hence, were
characterized as low performing. The
applicable value for 2002-03 is 182 districts, a decline of almost a quarter
(24.2 percent).
