Analysis of School District Local Tax Effort
New York State Education Department
State Aid Work Group
September 1999
Analysis of School District Local Tax Effort
The failure to maintain local tax effort or to respond fiscally to increases in State Aid by lowering tax rates has been a traditional concern of public finance experts. In view of the Regents’ emphasis upon the targeting of aid to high need school districts, and ensuring adequate resources are available to achieve high learning standards, such fiscal behavior has posed considerable concern to New York State policymakers as well. Any diminution of local tax effort in high need school districts, particularly if local tax effort is "inadequate" to begin with, poses a significant policy concern.
As part of the State Aid Work Group’s ongoing research agenda, two related study objectives were identified:
Discussion
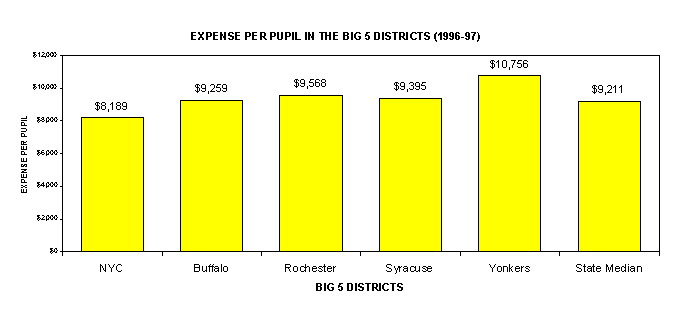
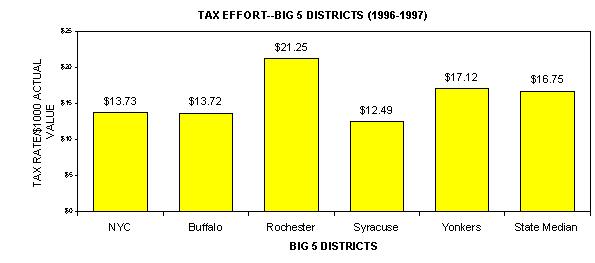
This analysis was conducted to address the tax effort problem. The fiscal response of school districts to increases in State Aid is currently being analyzed and will be described in a separate report. Two different measures of tax effort were used to describe the problem: a) lost levy – which refers to the amount of local tax revenue lost in 1996-97 because a district failed to tax itself at the median statewide tax rate of $16.75 per $1,000 in property value; and, b) effective lost levy – which refers to the portion of the lost levy that would have to have been raised to achieve a statewide median spending level per pupil of $9,211. Since many high wealth districts are able to achieve high spending levels with relatively low tax effort, such districts may fall into the "lost levy" category, but are invariably eliminated from the "effective lost levy" category.
Some districts may have a below-median tax effort and spend less than the median district whose students achieve high standards. In order to identify low spending, low taxing and districts needing to improve academic performance, the same notion of effective lost levy was used in conjunction with student performance on the New York State Fourth Grade English Language Arts (ELA) examination. A district with an average exam score of 645 points or above was considered to be achieving at an acceptable level, and was therefore removed from the "pool" of effective lost levy districts.
It should be noted that the cost of providing identical educational services varies among the different geographical areas of the State. Variations in regional cost were not factored into this analysis. If they were, some of the districts identified for low tax effort and low spending might not have been so identified since their spending adjusted for regional cost differences would have been sufficient to meet the spending level of the median district. Conversely, some districts which presently spend above the median could be identified as low spending districts, if a regional cost adjustment were used.
Conclusions/Findings
œ œ œ
Selected Characteristics of Effective Lost Levy Districts
Statewide (n=682 dist) |
Effective Lost Levy Districts (n=185 dist) |
Effective Lost Levy Districts w/Acceptable Performance (n=115 dist) |
Effective Lost Levy Districts w/Low Performance (n=70 dist) |
|
| Number of Pupils
Percent of Total |
2,795,544
(100.0%) |
1,345,075
(48.11%) |
196,553
(7.03%) |
1,148,522 96,604-w/o NYC (41.08%) (3.46% w/o NYC) |
| District Size | 1639 |
1290 |
1314 |
1238 |
| Extraordinary Needs Percent | 40.71% |
55.70% |
50.28% |
64.56% |
| Combined Wealth Ratio | 0.78 |
0.56 |
0.60 |
0.52 |
| Need Resource Index | 0.84 |
1.71 |
1.44 |
2.00 |
| TEACHING | ||||
| Class Size | 21.70 |
21.60 |
21.60 |
21.20 |
| Turnover Percent | 8.14% |
8.05% |
7.84% |
8.18% |
| Other Percent | 4.67% |
5.15% |
4.92% |
5.73% |
| Certified Percent | 95.33% |
94.85% |
95.08% |
94.27% |
Low Taxing, Low Spending and Low Performing Districts that have
Percent Residential Tax to 1996 Income Above the State Median of 3.0336%
|
|
District Code |
District Name |
Percent Residential Tax to 1996 Income |
1 |
120701 |
Franklin | 4.801% |
2 |
150301 |
Elizabethtown | 3.951% |
3 |
220202 |
Alexandria | 5.640% |
4 |
220909 |
Belleville – Henderson | 4.901% |
5 |
250401 |
Morrisville Eaton | 3.121% |
6 |
280216 |
Elmont | 4.103% |
7 |
451001 |
Lyndonville | 3.595% |
8 |
461901 |
Sandy Creek | 3.590% |
9 |
470901 |
Schenevus | 3.899% |
10 |
471701 |
Cooperstown | 3.535% |
11 |
472001 |
Richfield Springs | 3.227% |
12 |
472506 |
Worcester | 3.497% |
13 |
511201 |
Hammond | 3.935% |
14 |
540901 |
Jefferson | 5.788% |
15 |
560501 |
South Seneca | 3.451% |
16 |
591401 |
Monticello | 4.581% |
17 |
640101 |
Argyle | 3.299% |
18 |
651501 |
North Rose Wolcott | 3.480% |