New York State Education Department
Research Note
Wealth and Revenue Changes 1994-95 to 1998-99
Fiscal Analysis and Research Unit
Room 301 * 89 Washington Avenue * Albany, NY 12234
New York State Education Department
Wealth and Revenue Changes 1994-95 to 1998-99
December, 2001
Introduction
One of the many factors that affect school districts' financial decisions is the economic environment in which they operate. The period from 1994-95 to 1998-99 was unusual for several reasons. Most significantly, property values fell in several areas of the State. The statewide average Actual Value (AV) per pupil for operating aid fell from $299,800 to $246,400 after fifteen years of increases. (See the Appendix for technical definitions.) Conversely, 1998-99 saw a $1 billion increase in State Aid and the introduction of the School Tax Relief program (STAR), which provided an additional $582 million. Changes in enrollment (either growth or decline) and inflation also affect financial decisions. Thus, despite large aid increases, 246 districts experienced (inflation adjusted) per-pupil revenue losses during this period. This research note will examine the changing economic circumstances during these years and the effect on school district revenues.
Total Revenues
This period was apparently a very good one for school districts. State aid increased $2.1 billion between 1994-95 and 1998-99. The initiation of STAR provided an additional $580 million in State funds, for a total of $12.5 billion in State revenue, an increase of 27.5%. Local revenue increased $1.9 billion (14.2%) to $15.4 billion. Federal revenue increased $300 million to $1.3 billion. In all, school district revenue exceeded $29.3 billion in 1998-99, a 20.2% increase from 1994-95.
Property Wealth
The property tax is the dominant source of local revenue for most districts. Loss of property value, without an increase in the tax rate, will cause a reduction in local revenue. Between 1994-95 and 1998-99, AV/Pupil dropped in 329 school districts. The loss of property value was primarily a downstate phenomenon. Many of these districts have property wealth several times the state average (see Table 1). The statewide average AV/pupil dropped by $53,400 (from $299,800 to $246,400), approximately 18%.
Table 1 |
||||||||
Change in Wealth 1994-95 to 1998-99* |
||||||||
Geographic Category |
Change in Actual Value per Pupil |
Percentage change |
Change in Pupil Count |
1998-99 Actual Value per pupil |
Change in income per pupil |
1998-99 income per pupil |
Change in CWR |
1998-99 CWR |
Downstate small cities |
-$123,861 |
-23% |
11% |
$406,139 |
-$9,171 |
$163,718 |
-0.150 |
1.771 |
Downstate suburban |
-$166,008 |
-19% |
9% |
$698,250 |
$10,779 |
$150,912 |
0.008 |
2.289 |
Big 4 |
-$9,447 |
-5% |
3% |
$169,173 |
-$3,808 |
$59,241 |
0.010 |
0.685 |
Upstate small cities |
-$2,221 |
-1% |
0% |
$170,203 |
-$67 |
$59,905 |
0.045 |
0.691 |
Upstate suburban |
-$716 |
0% |
3% |
$223,301 |
$2,515 |
$66,728 |
0.080 |
0.838 |
Rural |
$22,488 |
10% |
-1% |
$249,910 |
$3,439 |
$45,669 |
0.139 |
0.770 |
New York City |
-$85,296 |
-29% |
6% |
$213,208 |
$1,954 |
$85,577 |
-0.071 |
0.927 |
State |
-$53,400 |
-18% |
5% |
$246,400 |
$3,100 |
$86,400 |
0 |
1.000 |
* The figures presented in this table are means for the district type. |
||||||||
Income Wealth
The change in income/pupil during this period was more varied. Statewide, the average income/pupil increased from $83,300 to $86,400 or about 3.7%. The Downstate Small Cities districts (-$9,171) and the Big 4 (-$3,808) experienced substantial decreases. The Upstate Small Cities districts (-$67) had an insignificant decrease. Despite modest gains, the Upstate Suburban and Rural districts remained below the statewide average income/pupil. Downstate Small Cities and Downstate Suburban districts remained well above the statewide average.
The Combined Wealth Ratio (CWR)
The Combined Wealth Ratio (CWR) is a measure of relative wealth, indexing each district against the statewide average on a combination of two factors, property wealth per pupil and income wealth per pupil. During times when the statewide average is decreasing, a district whose property value remained the same gained in relative wealth. For example, the 1994-95 to 1998-99 increase of $22,488 in average AV/pupil for rural districts represents about a 10% increase, yet their property wealth index went up at almost three times that rate—the difference caused by the statewide average decrease of about 18%. The combination of substantial decreases in AV/pupil and income/pupil caused the Downstate Small Cities districts to experience the greatest change in CWR, -0.150. However, their mean CWR, at 1.771, continued to be well above the statewide average. Loss of property value in NYC (-$85,296) was not offset by a modest gain ($1,954) in income/pupil, resulting in a 0.071 drop in CWR to 0.927. The other district types experienced a moderate increase in CWR. Upstate Small Cities and Upstate Suburban districts had a mean CWR of about 0.700. However, CWR is a relative measure; the higher CWR shown by the Rural districts (up 0.139 to 0.770) can be attributed as much to other districts losses as to Rural increases.
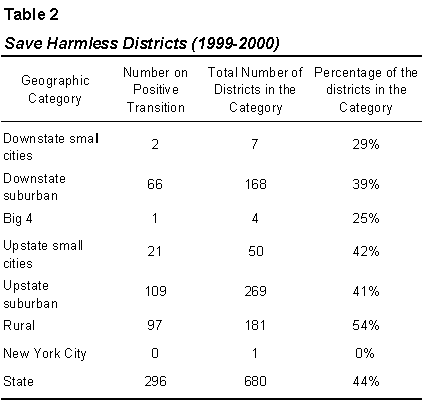
Save Harmless
Except for NYC and the Downstate Small Cities districts, mean CWR increased for each of the district types during this period. Increased local wealth may result in the loss of state aid, except when 'positive transition' also known as save harmless comes into effect. Save harmless is a feature of certain formulas that guarantees a district will not lose aid. Originally intended to protect districts experiencing radical enrollment changes, save harmless now impacts over 40% of all districts. Table 2 demonstrates that (with the exception of NYC) at least a quarter of all the districts in each type fall under save harmless, ranging up to 54% of Rural districts.
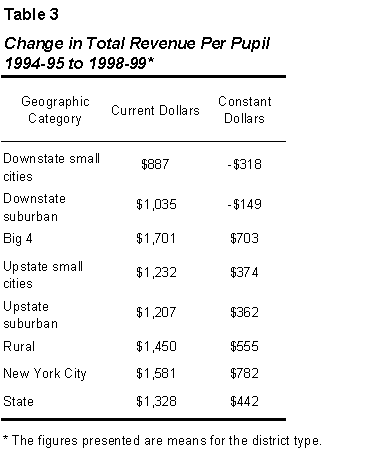
Inflation and Enrollment Changes
The combined effects of inflation and enrollment growth are shown in Table 3. For example, Downstate Small Cities districts appeared to enjoy a per-pupil revenue increase of $887 (current dollar basis). However, inflation and growth in enrollment converted the $887 increase into a $318 decrease (constant dollar basis). Statewide, a $1,328 increase was reduced to $442.
Impact on Revenue
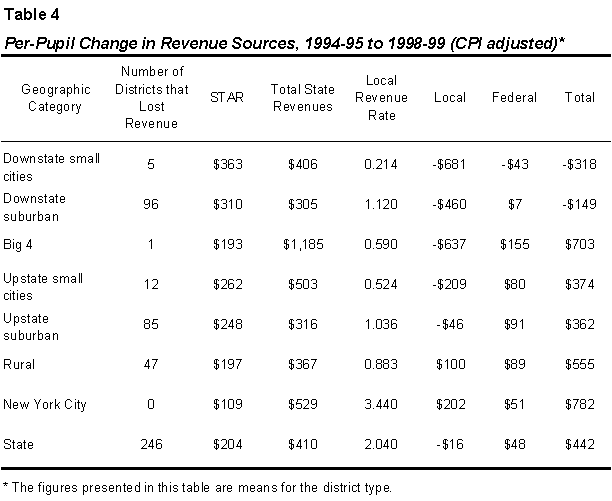
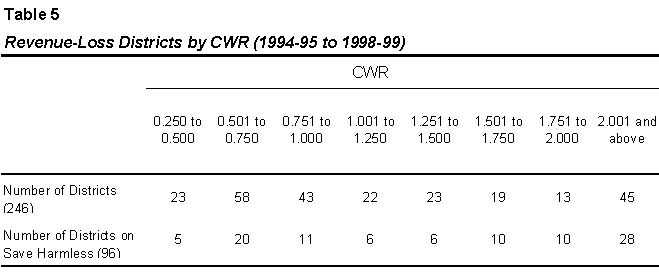
As shown in Table 4, local efforts to raise revenue generally increased during this period. However, the loss of property value tended to overwhelm modest increases in local effort; 381 districts experienced a decrease in local revenue/pupil. The STAR program is intended to reduce local property taxes, thus some reduction in local revenue/pupil must be attributed to the success of STAR. However, STAR revenues (which replace local revenue with State revenue) were not sufficient to cover the decline in local revenue in downstate districts. Overall, 246 districts lost total revenue on a per-pupil CPI-adjusted basis, as shown in Table 4. The 246 were evenly divided between above and below-average CWR. (See Table 5.) Notably, 96 districts on save harmless lost revenue; the fact that more than half of these districts are above-average wealth indicates that local revenue was lost.
Although the loss of property value was a downstate phenomenon, loss of revenue occurred throughout the state; more than one-third of all major districts lost revenue on an inflation-adjusted per-pupil basis. It is clear that the initial impression of good times for school districts was misleading. What appeared to be large revenue increases became decreases when inflation and enrollment growth are factored in. How did these 246 districts respond to the loss of revenue? One hypothesis might be that the response would vary depending on the wealth of the district. District wealth and reaction to revenue loss will be examined in a future research note.
Appendix: Technical Definitions
DISTRICTS TYPES.
School districts were classified into one of seven categories, based on geographic location and population density. The categories were Downstate Small Cities, Downstate Suburban, Upstate Small Cities, Upstate Suburban, Rural, Big 4 (Buffalo, Rochester, Syracuse and Yonkers) and New York City. Downstate districts are located in the counties of Nassau, Suffolk, Rockland, Putnam and Westchester.COMBINED WEALTH RATIO (CWR). Operating and other selected aids are distributed in part based on a combined wealth ratio, which compares district wealth per pupil to the State average wealth per pupil. The State average CWR is defined as 1.0. A district with a CWR of less than 1.0 has wealth below the State average. Conversely, a district with a CWR of more than 1.0 has wealth above the State average.
The CWR was calculated as follows: (.5 multiplied by the Pupil Wealth Ratio) + (.5 multiplied by the Alternate Pupil Wealth Ratio). Each wealth ratio was computed by dividing the district's wealth (FV or income) per pupil (pupils being a weighted pupil count called TWPU) by the State Average wealth/pupil as defined in law.
TWPU or Total Weighted Pupil Units is a weighted count based on the adjusted average daily attendance of K-12 pupils resident in the district plus additional weightings for pupils with special educational needs, pupils with disabilities, and secondary school pupils; half-day kindergarten pupils are weighted at 0.5. The Pupil Wealth Ratio is equal to Selected Full Value of property divided by TWPU.
Depending upon the aid year and specific districts, the property value used may be for a single year, a two-year average or a two-year average for which the increase in property value cannot exceed a specified percentage. The Alternate Pupil Wealth Ratio is calculated by dividing the Adjusted Gross Income of a district by TWPU. For the 1998-99 school year, the State average AV/TWPU was $246,400 and the average Income/TWPU was $86,400.
REVENUES. Three revenue sources (State, Local, and Federal) are displayed for three funds (General Fund, Debt Service Fund and Special Aid Fund). In 1994-95, revenues from the Risk Retention Fund were also included. However, beginning with the 1997-98 school year, the Risk Retention Fund no longer existed. The revenue sources and the account codes used to calculate them are described below. Due to the implementation of the School Tax Relief program (STAR) it was necessary to have three distinct categories for revenues from State Sources.
This total may differ from other publications of the Department, since this report is based on major districts (eight or more teachers).
About This Research Note
This SED Research Note was produced by the Fiscal Analysis and Research Unit.
Obtaining Copies of SED Research Notes
This report may be accessed on the Internet at: http://oms.nysed.gov/faru. Hard copies may be obtained by writing to the Fiscal Analysis and Research Unit at: 301 Education Building, 89 Washington Ave. Albany NY 12234.